Happy 250th America…Let’s Celebrate all year long!! Initial jobless claims for the week ending March 14 decreased by 8,000 to 205,000…The consensus was 215,000. What does it mean – Continuing claims were little changed, indicating stable labor market. This will probably keep the Fed preoccupied for now with the inflation side of its mandate. Future reports like this may make it tough for the Fed to cut rates in the future. Producer Price Index was up 3.9%, versus 3.6% in January…The uptick is from the survey prior to the war in Iran. What does it mean – After the survey came out oil prices have spiked to over $100 per barrel. This will surely hit consumer pocketbooks. The Philadelphia Fed’s manufacturing index edged up…Coming in above the consensus forecast. What does it mean – This report marked the fourth straight monthly increase in industrial production. 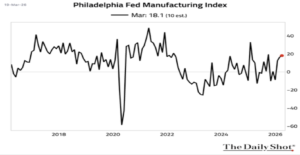 Deregulation…An LLM-based deregulation index for the US has reached the highest level in decades. What does it mean – From the Chart below you can see that deregulation often coincides with economic expansion. According to the opening statement from the most recently released report from the White House Economic Council. “Excess regulation harms economic activity by increasing compliance costs and misallocating resources away from more profitable activities, thus discouraging innovation, investment, and economic growth. Regulatory complexity coupled with high compliance costs can also act as a barrier to entry, sheltering incumbent producers and stifling competition, thereby reducing startup activity and job formation. Moreover, onerous regulations can lead to higher prices, reduced opportunities, an increase in the poverty rate, and disproportionate impacts on small businesses”. This letter has been consistently pointing out exactly what The White House Council Of Economic Advisors reported in their 2025 report. Below is a graph of previous periods where we saw deregulation.